Sustainable business starts with insight
Signips puts figures you already have, from your business and building systems, on the screens in your buildings. There, employees and management see how the sustainability goals are progressing and where to act.
See how your office space is used
Occupancy sensors measure which desks and zones are in use. Signips shows that occupancy per building or per floor. Patterns over a week come from your own report, for example in Power BI, so facilities and management can base decisions about space on the figures.
- Live desk and area occupancy from your sensor platform
- Patterns per building or floor from a Power BI report
- The same figures for employees, facilities and management
Energy use where everyone can see it
Show electricity use, temperature and the comparison with an earlier period on the screens in the building. The system that measures them stays the source, and the figures reach the screen through a Power BI report, the API, a sensor platform or a feed we build on request.
- Electricity use and temperature per building or floor
- This period next to an earlier one
- Through Power BI, the API, a sensor platform or a feed on request
Paper use, counted in pages or kilograms
Print volume is shown primarily in pages or kilograms of paper. The numbers come from your own print management reports and reach the screen through Power BI, the API or a feed built on request. An equivalent in trees or CO₂ can stand next to them as an illustration, with the calculation shown. For trees no universal conversion factor exists, so the assumptions belong on the screen.
- Print volume in pages or kilograms of paper
- Compared with the previous period
- Equivalents only with their assumptions stated
Progress on your goals in the daily news
The current progress on your sustainability goals runs in the same playlist as the company news and the lunch menu, so colleagues see every day where things stand. The sustainability team publishes its own items, with rights that reach no further than its own topic.
- Current progress per goal, with the reference year
- In the same playlist as news and announcements
- Published by the sustainability team, with rights for its own topic only
An example dashboard with demo figures
This screen shows four indicators for one quarter. It says that its figures are a demo and names the period, each tile says what its figure is compared with or based on, and the CO₂ tile says that its figure is calculated.
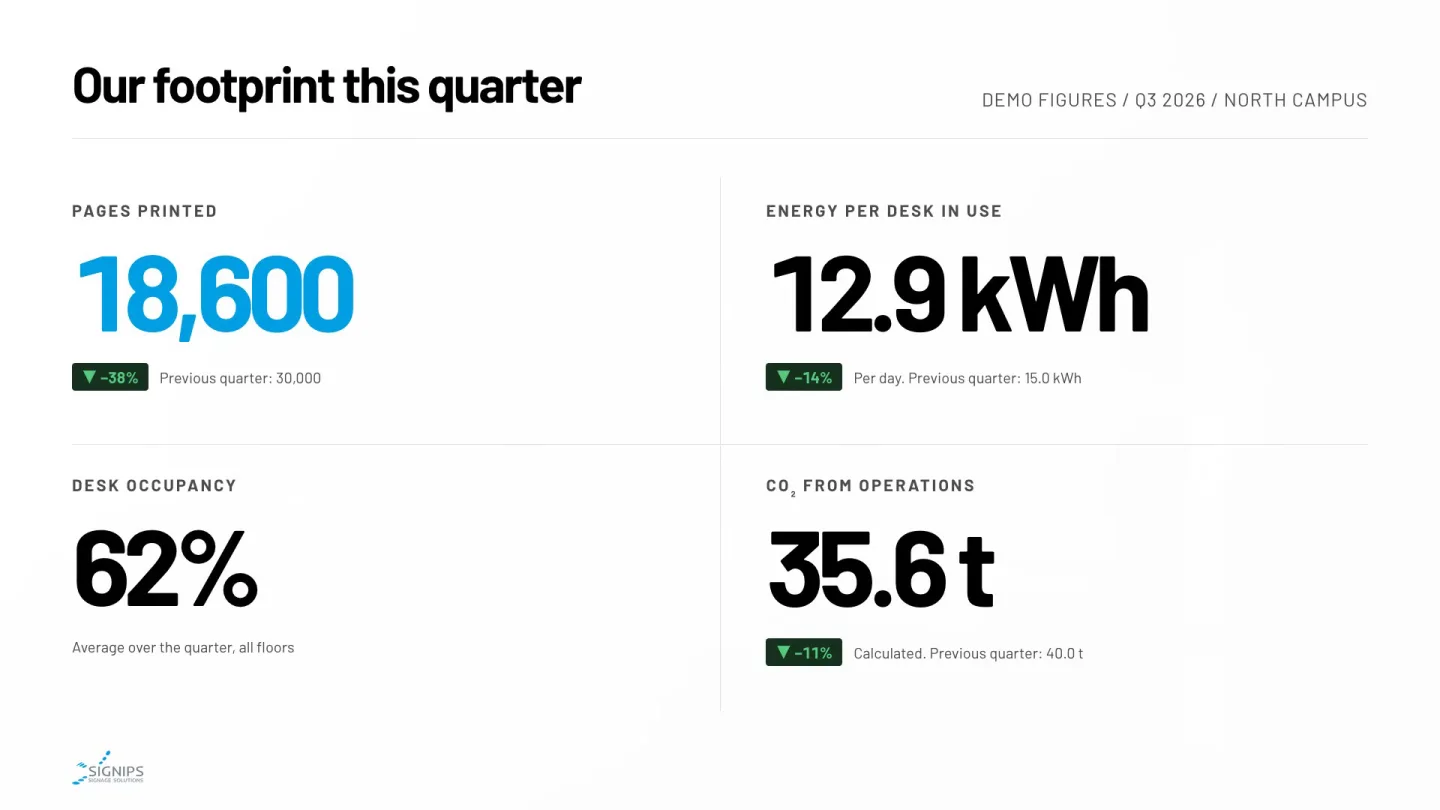
These are fictional demo figures
On a real screen your own data takes their place. The period and the calculation method belong on the screen with it, so anyone can check the figures.
The four indicators on this screen
- Print volume
- 38% fewer pages printed
- Compared with the previous quarter
- Energy
- 14% less energy
- Per desk in use, compared with the previous quarter
- Desk occupancy
- 62% occupied
- Average over the quarter
- CO₂
- 11% calculated reduction
- Emissions from operations, compared with the previous quarter
What Signips does, and what stays with you
Signips does not save energy, office space or CO₂ by itself. The platform makes the figures visible, and that can support the decisions and the changes in behaviour that lead to savings.
What Signips does
- Shows figures from your own systems on the screens people pass every day
- Takes them in through a Power BI report, the API, a sensor platform or a feed built on request
- Gives the period, the comparison basis and the calculation note a place on the screen
What stays with you
- The measurements and the systems they come from
- The calculation method and the assumptions behind every figure
- The decisions and the behaviour that turn insight into a saving
An equivalent such as a number of trees has no universal conversion factor, so state your assumptions on the screen every time.
The power and hardware the screens themselves use
A network of screens uses power and hardware too. This is how Signips deals with that.
The TV is off outside the hours you set
The player switches the TV on and off on schedule over HDMI-CEC. You set the times per screen, per location and per weekday.
E-Ink for door signs and wayfinding
E-Ink panels don't glow and use very little power. They take their content from the same platform as every other screen.
Player hardware supported for 10+ years
We keep player hardware supported for more than ten years, and software updates reach every player remotely.
The other four departments on the same platform
They use the screens and players you already have and are managed in the same place. Each department can publish only to its own screens and topics.
- Internal communicationNews, HR messages, changes, events and welcome screensRead more
- Production & operationsKPIs, live dashboards, schedules and production statusRead more
- Facilities & workplaceDesk occupancy, free desks and building informationRead more
- IT & central managementCentral control, rights, monitoring and continuityRead more
See how it looks with your own content.
We'll build a virtual screen using your brand and content. Free and without any obligations.