Desk occupancy, free desks and building information on screen
Signips shows free desks per floor, room agendas, wayfinding and building information on the screens at the entrance and on every floor. The occupancy comes from your own sensors, and the same figures can feed decisions about space.
Free desks per floor, straight from your sensors
Occupancy sensors register which desks are taken. Signips shows the result where people choose a place to work: at the entrance, by the lifts and on each floor. Colleagues walk straight to a floor with room, and facilities sees at a glance how full each floor is.
- Live desk and area occupancy from your sensor platform
- Free desks per building, floor or zone
- One template for all floors, each with its own figures
Rooms and routes from your own calendars
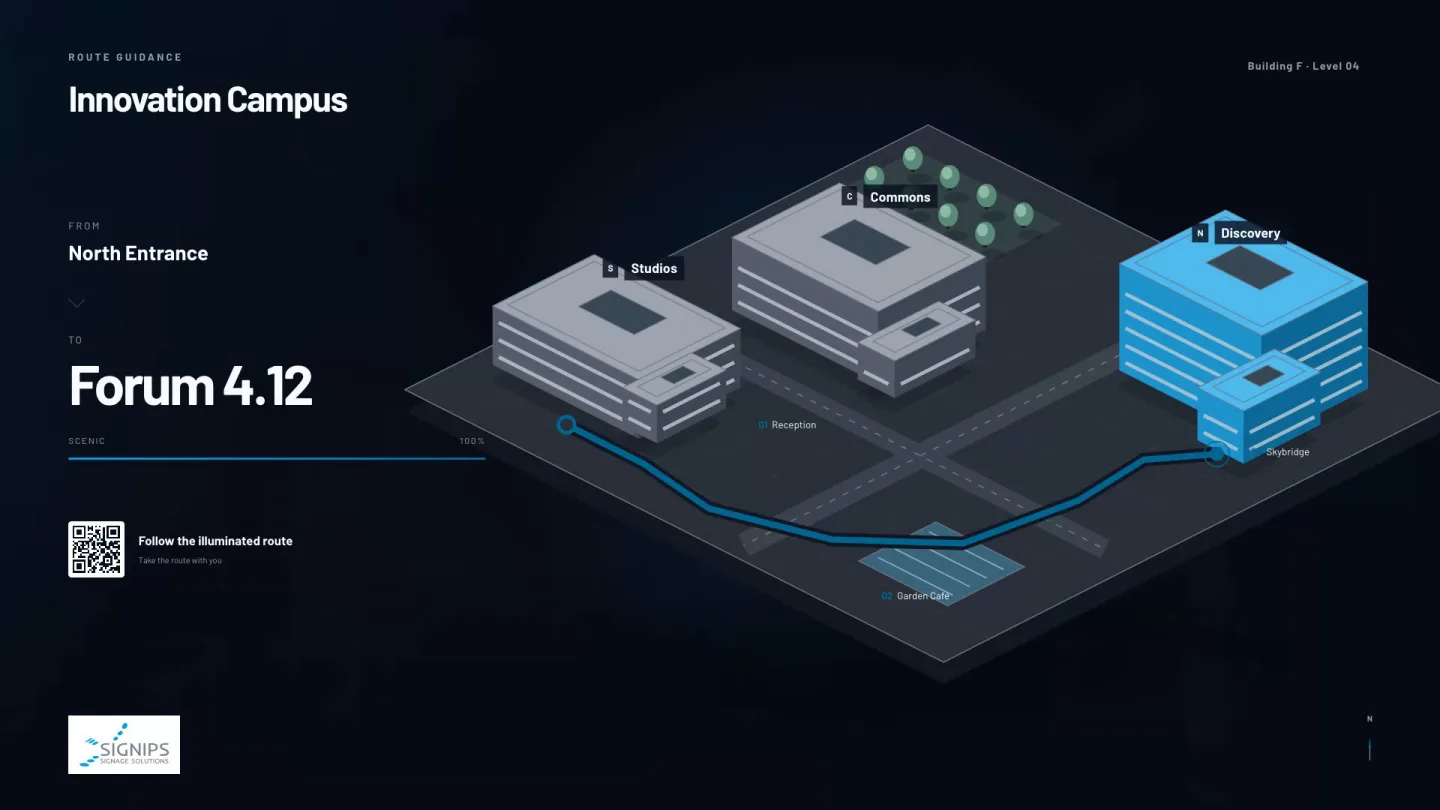
Room screens and E-Ink door signs follow your Google or Microsoft 365 calendars, so a booking made in the calendar appears on the door without anyone typing it again. A wayfinding screen at the entrance sends visitors to the right room, and reception can put a meeting on screen in five clicks.
- Room agendas from Google or Microsoft 365 calendars
- E-Ink door signs that use very little power
- Wayfinding for visitors at the entrance
Building information on the right floor
Lift maintenance on the third floor or a fire drill on Friday: facilities publishes the message once and picks where it shows, down to a single screen. Each team's rights reach as far as its own screens. In an emergency one button takes over every screen in the part of the building you choose.
- Publish per building, floor or single screen
- Rights per team, as narrow as a single screen
- Emergency broadcast per building, floor or wing
From occupancy figures to decisions about space
Signips shows the occupancy your sensors measure. The same insight can feed a bigger decision: how many desks and how much floor space your organisation needs. The calculator below works through that sum with example figures, and you can replace them with your own.
Occupancy calculator
Start from the example or enter your own five figures. The outcome is a theoretical sum.
Your assumptions
An illustration, not a forecast for your organisation
This only becomes a real saving if you can actually give up the space, sublet it or use it differently. Take into account peak load, the spread over the days of the week, rooms with a fixed function and contractual obligations such as your lease.
How the sum works
- Desks in use at the peak300 × 60% = 180
- Desks needed at the target occupancy, in theory180 ÷ 80% = 225
- Fewer desks, in theory300 − 225 = 75
- Floor area of those desks75 × 12 m² = 900 m²
- Annual cost of that floor area, in theory900 m² × €300 = €270,000
Desks are rounded up to whole numbers.
The other four departments on the same platform
They use the screens and players you already have and are managed in the same place. Each department can publish only to its own screens and topics.
- Internal communicationNews, HR messages, changes, events and welcome screensRead more
- Production & operationsKPIs, live dashboards, schedules and production statusRead more
- Sustainability & ESGEnergy, paper, CO₂ indicators and progress on goalsRead more
- IT & central managementCentral control, rights, monitoring and continuityRead more
See how it looks with your own content.
We'll build a virtual screen using your brand and content. Free and without any obligations.